Canada Council for the Arts announced its unique Digital Strategy Fund (DSF) in March 2017 with a sense of urgency: “The fund is part of a catch-up movement for the vast majority of the arts sector, which is at risk of being less and less visible and less supported by citizens (…)” As a strategic fund, it is time-limited and was to operate from 2017 to 2021. The Digital Strategy Fund is worth $88.5 million.
UPDATE August 12, 2019
Canada Council for the Arts’ Strategy and Public Affairs supplied to me new tables on August 9, 2019. My initial analysis was based on Canada Council’s grants database information. That public information does not include the amounts committed by Council to multi-phase projects as those funds will be released based on interim project report. The different between the Grants data base as of August 9, 2019 and the actual allocated pending reports is just over $7 million, i.e. $36 million as opposed to close to 29 million. Another difference was in the year to which projects were allocated, i.e. many of the projects marked 2019 actually belong to the 2018-2019 fiscal year and are now marked 2018.The basic point of the analysis remains: less than half the available fund have been allocated so far leaving significant opportunity space for new applications to the fund.
Tables below are updated using the new data supplied by Council.
I hope it will illuminate where funding has gone and help see where the digital opportunities spaces might lie for the upcoming September 18, 2019 deadline for the next full round of funding.
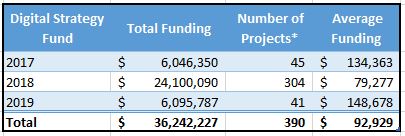
Table1 Digital Strategy Fund 2017 to 2019
In total, the DSF has spent $36 million for 352 projects for an average of $102,961 per project. (*IMPORTANT NOTE: The total number of projects funded is 352 over this period, however, multi-year projects are counted in each of the fiscal years in which funding is awarded.) 2018 saw nearly seven times as many projects funded, resulting in a quadrupling of funding allocated. The average funding in 2018 is substantially lower because it includes a round of funding for core funding recipients that maxed out at $50,000.
$36 million represents only 40% of the total ear-marked funding. It is clear: there is tremendous opportunity to obtain funds for bold digital experimentation in and a great deal of learning about the digital realm with the remaining $52 million over the next two years.

Table 2 DSF Funding Funding Streams
During these first two years, Digital Literacy projects have 25% of all funding allocated. Public Access and Citizen Engagement stream received 29% of funds – representing 16% of projects, while the Transformation of Organizational Models received about 26% of all funding for close to 10% of all projects. This assumes all multi-phase projects will proceed beyond their initial phases and the allocated funds will be disbursed. The Special digital projects for core grant recipients makes up about one fifth of the funds spent, but half of the projects. The multi-phase projects while few in number represent a very significant investment of the life of the projects in particular when they meet their go/no go metrics positively.
In a sector that by and large is lagging in the adoption of contemporary and leading digital tools and methods, these figures paint an encouraging picture: Not only are arts organizations embarking on becoming well versed in the use of digital tools but a considerable number are working toward producing, marketing and distributing participatory and receptive arts experiences by experimenting with and leveraging the tools and methods of the digital realm; and 34 projects representing $9.5 million ($5.7 ,million of funds have been released pending multi-phase project go decisions for later phases) are looking at what digital transformation might look like for their organizations and sectors.
These projects are predicated on partnerships and generating significant benefit for more than the lead applicant. As such seeing a segment of the arts and culture sector embracing this opportunity to obtain risk capital for strategic organizational model and business model experimentation in the digital world is encouraging.
Canada has become highly urbanized, with about 17 million Canadians living in the six largest urban centres, and more than 80% living in urban and sub-urban areas of Canada. This begged the question about the geographic distribution of funds so far.

Digital Strategy Fund Cities vs the Rest of Canada 2017 – 2019
The six largest urban centres across Canada have received 68% of all funding even though their general population comprises about about 47%. This suggests that there is a greater concentration of organizations and activities in the digital realm in the largest cities. Nonetheless, $11.5 million have gone to cities under 1 million as well as smaller jurisdictions including a few in rural and remote places. The average level of funding per project is on par when we exclude the special projects at about $103,000. Still, one of the promises (opportunities, challenges) of the digital realm is that it might create a more level playing field for geographically disadvantaged and systematically excluded places and people. There is a need to explore how smaller communities can build the capacity needed to access more of this funding.
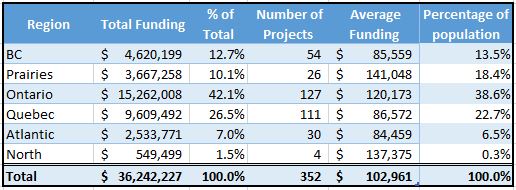
Digital Strategy Fund 2017-2019, Regions
Further analysis shows that every region in the country has benefited from the Digital Strategy Fund; and it matches quite well to the size of population, with only the three Prairie provinces under-performing significantly by the measure of general population.
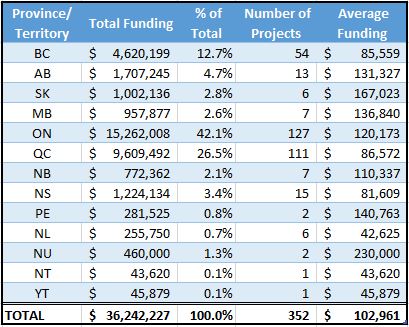
Table5 Digital Strategy Fund 2017 to 2019, Provinces and Territories
Perhaps not surprising given their population base or remoteness, the Northern Territories and PEI have received funding for only 1 to 2 projects each so far. While on a population basis this would be deemed adequate, it does not reflect the depth and breadth of the arts and cultural communities.
In my work with arts and cultural organizations in every province and territory in Canada over this decade, I have seen exceptional arts communities in unlikely places and without exception they have an interest in staking a claim in the digital realm. I expect and hope to see more winning proposals from strong local arts and culture sectors in Nunavut and Yukon as well as Vancouver and Gulf Islands, BC Interior, NWT, Newfoundland, rural Maritimes as well as cottage country in Ontario.
Bottom line: with 60% of the ear-marked funding envelope not yet spent, the time is ripe for a plethora of proposals for the September 18, 2019 deadline. Plus there is money available for Digital Literacy projects under $50,000 to succeed any time you need them – indeed, you can apply as often as you need under this component!
Let’s get on it! Let’s talk!
Notes: I collated this spreadsheet DSF_2017to2020_Aug2019 from the data points on Canada Council for the Arts’ proactive disclosure website. It represents 337 projects and is based on a data pull on August 2, 2019.
The funding database for DSF does not specify the artistic disciplines or whether it belongs to an equity-seeking group.
The three funding streams allocate either up $250,000 for single phase or $500,000 for multi-phase projects, and up to 85% of total eligible costs for a new project or 50% to refine or optimize an existing one. By any measure this is a significant and unique investment in the arts and culture sector in Canada. New in 2018 was that Digital Literacy projects of up to $50,000 can be submitted any time to be approved internally at Canada Council within a few weeks, ie without convening an expert jury. Also new was that the expectations around having a partnership lead these projects has been loosened to specify that it must benefit a wider group.
Three rounds of funding have taken place: the first closed in fall 2017 with funded projects announced in April 2018, the second one closed in fall 2018 with projects announced in April 2019, and the third one targeting organizations that receive core funding from Council was published in summer 2019.
